Hecos Dashboard
About this Project
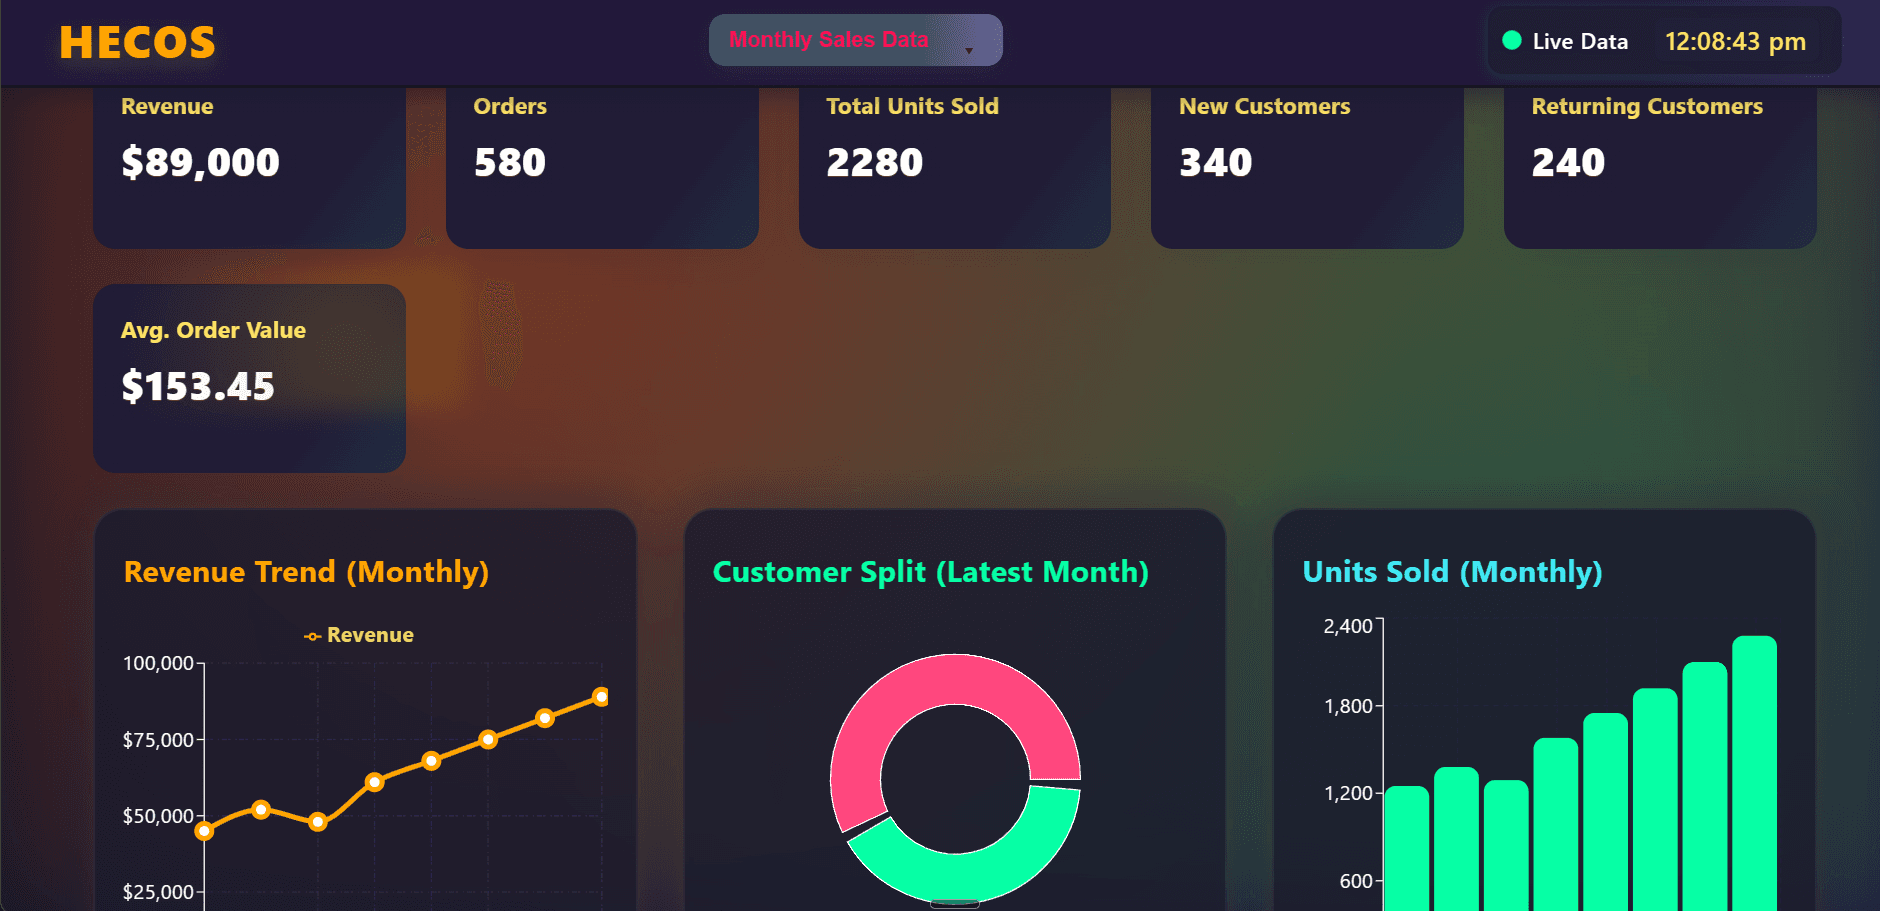
📊 HECOS Dashboard is a sleek React.js web app that integrates live data from Google Sheets to deliver real-time charts, analytics, and visual metrics. Designed with a responsive UI, it adapts seamlessly across desktop, tablet, and mobile devices. ⚡ Built with Create React App, styled via CSS3 and deployed on Vercel, it focuses on fast performance, clean design, and intuitive navigation. Useful for teams, data analysts, or anyone needing a dynamic data dashboard with live updates.
Key Features
- •Real-time data synchronization with Google Sheets API for live updates
- •Interactive charts and graphs with multiple visualization types
- •Responsive dashboard layout optimized for all screen sizes
- •Custom analytics widgets with filtering and sorting capabilities
- •Dark/light theme toggle for better user experience
- •Export functionality for charts and data in multiple formats
- •Real-time notifications for data changes and updates
- •Fast loading performance with optimized API calls and caching
Challenges & Solutions
Key challenges included implementing efficient real-time data synchronization without overwhelming the Google Sheets API, creating responsive chart layouts that work across devices, managing state for multiple data sources, and optimizing performance for large datasets while maintaining smooth user interactions.
What I Learned
This project significantly improved my React.js skills, taught me advanced API integration patterns, real-time data handling techniques, and responsive design principles for complex dashboards. I also gained experience with Google APIs, data visualization libraries, and performance optimization for data-heavy applications.